Upload your KDP Orders Excel file and we'll do the rest. Get it from KDP Reports → Orders — pick a date range that covers at least 2 weeks before and after your change.
Drop your KDP Orders Excel file here
or click to browse
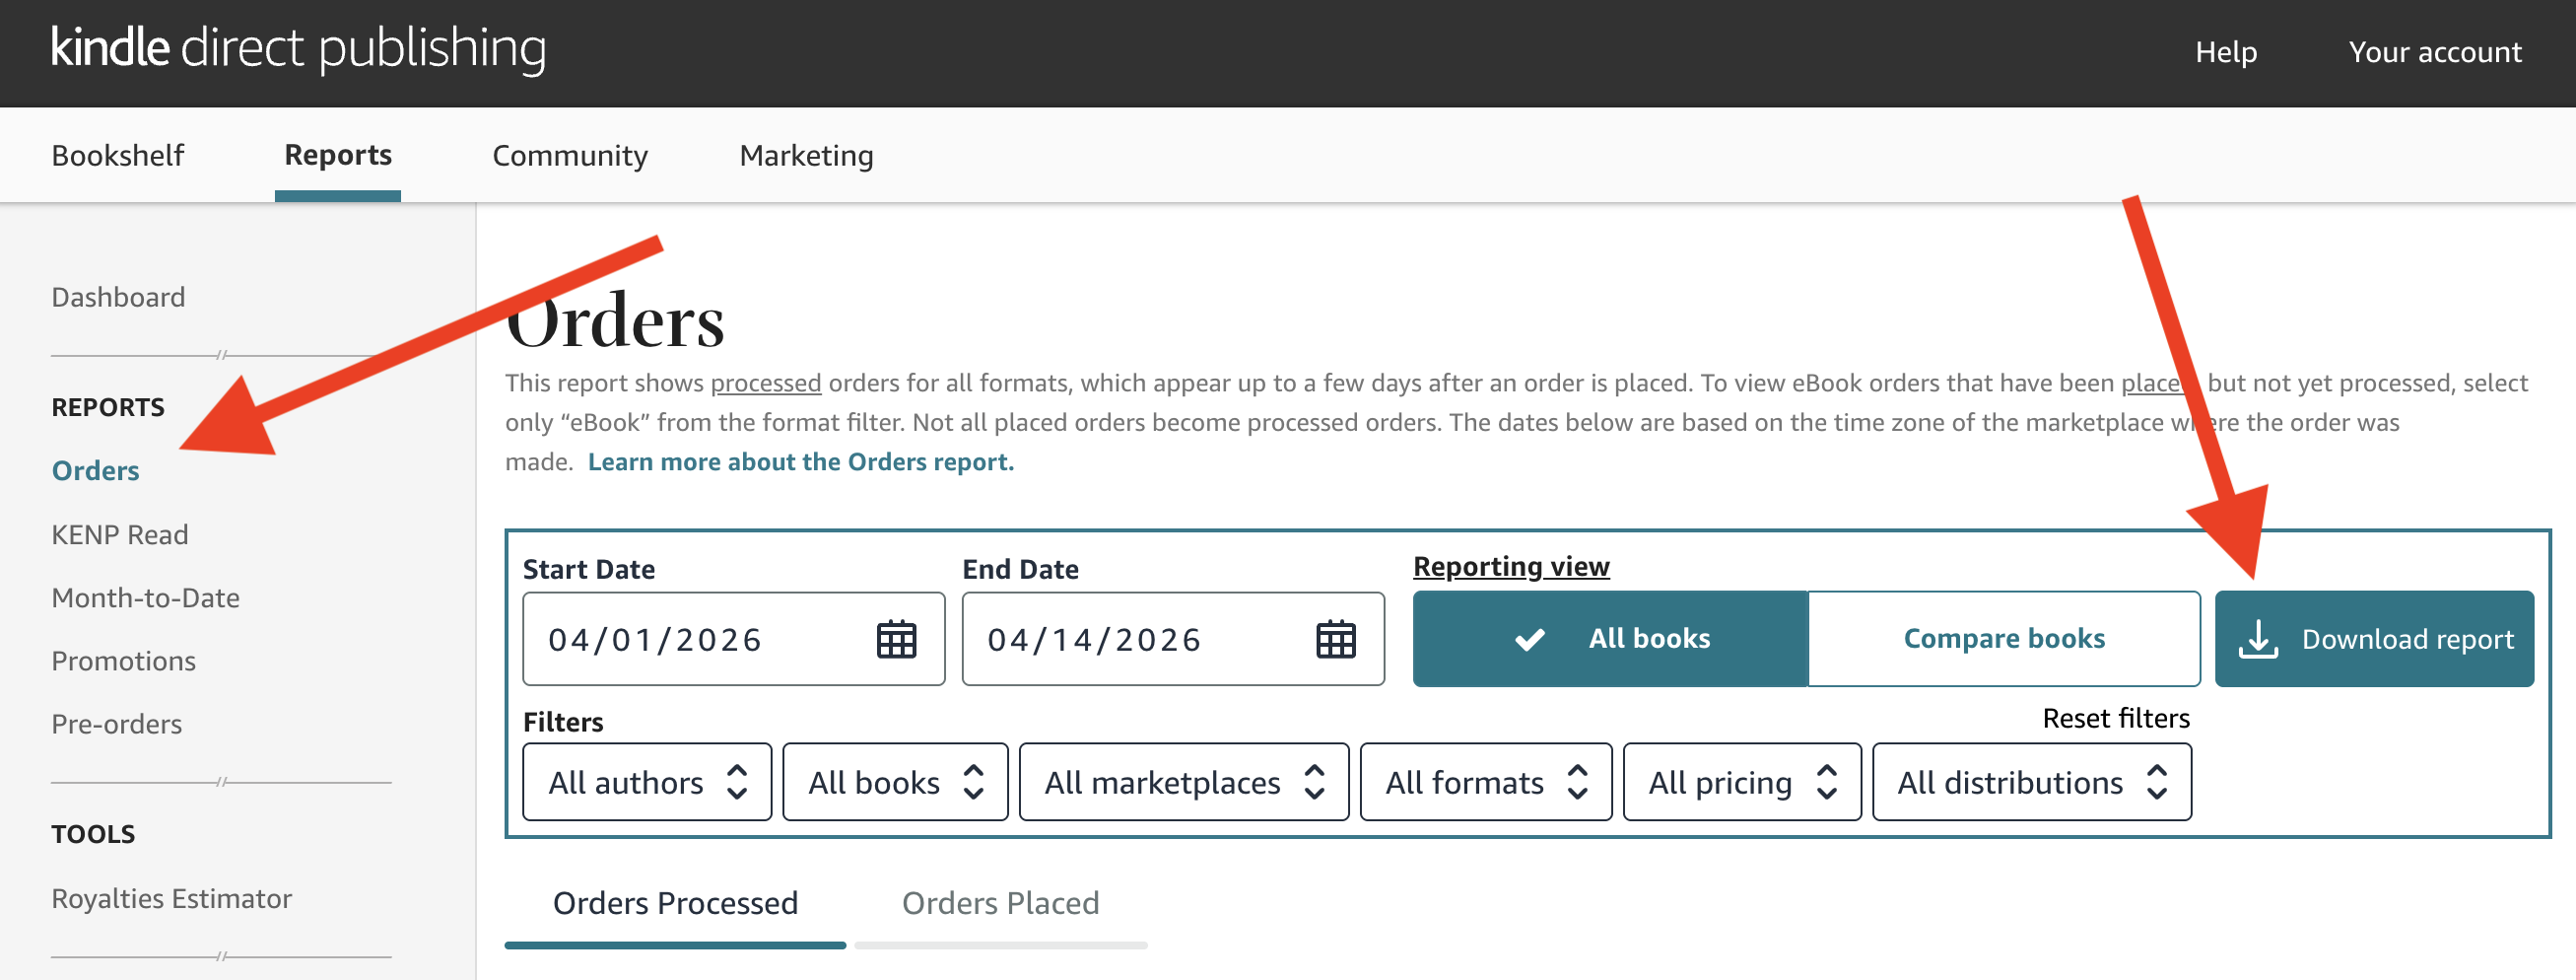
Where do I get this file?
- 1. Go to
- 2. Set a date range that covers at least 2 weeks before and after your change
- 3. Click “Download report”
How Long Should I Run My Test?
Figure out how many days of data you need before you start — so you know when you'll have enough to get a real answer.
Typical daily sales, page reads, etc.
As a %. Example: 20% = a jump from 10 to 12/day
Why Test Your Listing Changes?
Sales fluctuate naturally from day to day. A new cover might seem like it boosted sales, but is the increase real — or just a lucky week? Statistical significance testing separates real improvements from random noise, so you can make decisions based on evidence instead of guesswork.
Data-Driven
Not gut feeling
Before vs After
Compare periods
Plan Ahead
Know how long to test
How to Run a Book Listing Experiment
- 1Record your daily sales or page reads for at least 7-14 days (your “before” period)
- 2Make one change to your listing — cover, title, description, A+ content, or price
- 3Record the same metric for another 7-14 days (your “after” period)
- 4Paste both sets of numbers above and click “Calculate Significance”
Frequently Asked Questions
What is A/B testing for a book listing?
A/B testing means making one change to your listing (like a new cover or title) and comparing your sales or metrics before and after. By collecting enough data and running a statistical test, you can determine whether the change actually caused an improvement — or whether the difference was just normal day-to-day variation.
What's a statistically significant result?
A result is statistically significant when there's strong evidence that the difference you see is real, not random noise. We use a 95% confidence threshold — meaning there's less than a 5% chance the difference is due to luck. If your result hits 95%+ confidence, you can be reasonably sure the change made a real impact.
How long should I run my test?
At least 7 days per period is a good minimum, but 14+ days is better. Shorter tests are more likely to produce misleading results because of day-to-day sales fluctuations. Use the sample size calculator below to estimate how many days you need based on your typical sales volume.
Where do I get the data I need?
For daily sales and page reads, check your KDP Reports dashboard — you can export daily data from the Sales Dashboard. For ad metrics like impressions, clicks, and orders, check your Amazon Advertising console. You can paste daily numbers directly from a spreadsheet.
What's the difference between the two test modes?
Use "Daily Metrics" when you have day-by-day numbers like sales per day or page reads per day. Use "Conversion Rates" when you have totals — like total ad impressions and total clicks — and want to compare the rate (e.g., click-through rate) before and after a change.
What's a p-value?
The p-value tells you the probability of seeing a difference this large (or larger) if the change had no real effect. A p-value of 0.03 means there's only a 3% chance the improvement is due to random variation. Lower p-values = stronger evidence that your change worked.
Can I test multiple changes at once?
It's best to change one thing at a time. If you change your cover AND your description simultaneously, you won't know which change drove the improvement. Make one change, collect data, test significance, then move on to the next change.
Take your book marketing further.
Scrivy helps self-published authors get real reviews from verified readers. Sign up free to get started.
Get started free